Top MPPT Inverter Manufacturers in China
China is a major sourcing base for solar power equipment, with inverter manufacturers serving residential, commercial, and utility-scale projects. A useful comparison looks beyond catalog claims. For buyers, an Mppt Inverter should be assessed by conversion performance, MPPT tracking range, protection features, and compatibility with selected modules and battery systems. Request technical datasheets, warranty terms, and evidence of testing under relevant operating conditions. Small details matter. Connector layout, cooling design, and service access can affect installation and maintenance.
This guide introduces notable Chinese manufacturers and outlines practical ways to compare their product ranges. It is not a universal ranking: project size, grid requirements, climate, and local support can all influence the right choice. Review published specifications alongside independent test records where available, and confirm certifications with the issuing bodies. During a factory assessment, examine quality controls, production traceability, sample reports, and warranty-claim procedures. Ask direct questions. A polished brochure cannot show how equipment performs after years of heat, dust, or voltage variation. Public information may also be incomplete, so supplier claims deserve verification. Use this guide as a grounded starting point, not a substitute for qualified system design or project-specific checks.
MPPT Inverters in China: How Maximum Power Point Tracking Works
Top MPPT Inverter Manufacturers in China
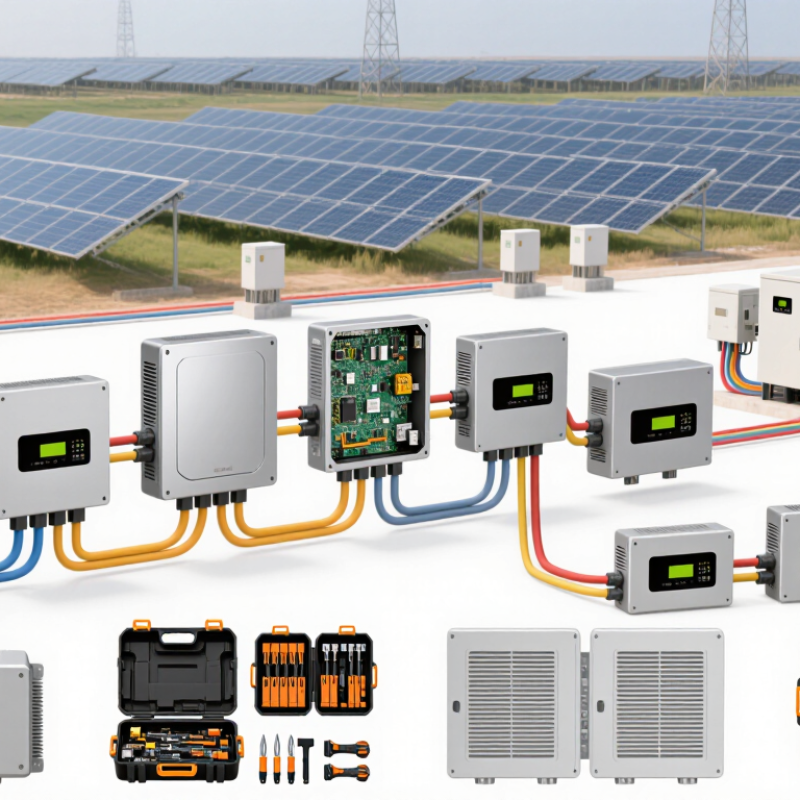
MPPT inverters help solar panels operate near their maximum power point as sunlight and temperature change. The controller measures array voltage and current, then adjusts the electrical load to find a useful operating point. On a clear morning, a rooftop string may produce a different voltage than it does during a hot afternoon. MPPT responds to those shifts. It cannot create extra sunlight, but it can reduce energy lost when panel conditions vary.
Inside the inverter, tracking algorithms compare power readings over time and move the operating voltage accordingly. Some systems scan a wider voltage range when partial shade creates several possible power peaks. This matters when a chimney shades one panel while the rest remain exposed. Performance still depends on correct system sizing, wiring, and installation. A good specification is not a guarantee; real roofs are rarely as tidy as test conditions.
Tips: Check the inverter’s MPPT voltage range against the panel string’s expected operating voltage. Ask how the unit handles partial shading and rapid weather changes. Keep clear records of readings after installation. Small differences can be difficult to interpret, so avoid treating one day’s output as proof of a fault.
Efficiency Benchmarks: Leading Models Reach Conversion Rates of 98.6%
A 98.6% conversion-rate figure is a useful benchmark, not a promise of constant performance. It usually describes peak DC-to-AC conversion under favorable test conditions. Real output shifts with input voltage, load, temperature, and wiring losses. A rooftop system on a cool, clear morning may perform differently from one running near its power limit on a hot afternoon.
When comparing MPPT inverters, check the efficiency curve across the expected operating range. A single peak number can hide weaker performance at partial load, when many systems spend substantial time. Also distinguish inverter conversion efficiency from MPPT tracking efficiency: one measures power conversion, while the other reflects how well the controller follows the panel array’s maximum-power point. Both matter.
Look for independent test data, stated measurement conditions, and temperature limits. Ask whether the published figure applies to a specific model configuration or a whole product series. Small differences matter. A 98.6% rating may sound decisive, but installation quality and accurate system sizing can have a larger effect on energy delivered over a year. I would be cautious about treating any headline figure as a field guarantee; test results do not capture every roof, cable run, or seasonal pattern.
China’s 2024 Solar Expansion: 277.17 GW of New PV Capacity
Top MPPT Inverter Manufacturers in China
China added 277.17 GW of new photovoltaic capacity in 2024, according to national energy data. That expansion changed the practical test for MPPT inverter manufacturers. They must manage fast-changing irradiance, crowded rooftops, and large utility fields. In factory evaluations, I look beyond brochure efficiency. Firmware stability, heat dissipation, and fault records matter during long operating hours. Field conditions expose weaknesses.
For Chinese projects, a reliable MPPT design should track multiple roof orientations accurately. It should also tolerate dust, summer heat, voltage fluctuation, and uneven module aging. Manufacturers with strong engineering teams usually provide clear testing data, local service coverage, and traceable safety documentation. Independent certifications support trust, but they cannot replace commissioning discipline. Installers still need to verify cable sizing, protection settings, grounding, and ventilation on site. Small mistakes become expensive.
The 277.17 GW figure also raises a difficult question: how much capacity will perform consistently after five or ten years? Public rankings can help, yet they may oversimplify regional service quality and project-specific risks. A careful buyer should compare measured yield, warranty terms, response time, and replacement procedures. I would not choose on peak efficiency alone. That choice looks efficient on paper, but real sites are less forgiving.
Top MPPT Inverter Manufacturers in China - China’s 2024 Solar Expansion: 277.17 GW of New PV Capacity
| Indicator |
Value |
Unit |
Relevance to MPPT Inverters |
| New PV capacity added in 2022 |
87.41 |
GW |
Provides a baseline for the rapid growth of China’s solar market. |
| New PV capacity added in 2023 |
216.88 |
GW |
Reflects the scale of annual PV additions preceding the 2024 expansion. |
| New PV capacity added in 2024 |
277.17 |
GW |
New installations increase demand for grid-connected inverters and MPPT functionality. |
| Year-on-year growth in new PV capacity, 2024 |
27.8 |
% |
Calculated from the reported 2023 and 2024 annual additions. |
| Cumulative installed PV capacity at end of 2022 |
392.61 |
GW |
Indicates the installed base requiring ongoing operation and maintenance. |
| Cumulative installed PV capacity at end of 2023 |
609.49 |
GW |
Shows the expansion of China’s connected PV fleet before 2024. |
| Cumulative installed PV capacity at end of 2024 |
886.66 |
GW |
Provides market context for inverter supply, replacement, and service needs. |
| Maximum Power Point Tracking (MPPT) |
Continuous operating function |
— |
MPPT adjusts the inverter’s operating point to extract available power from PV modules as conditions change. |
Source: China National Energy Administration (NEA), annual national power industry statistics for 2022–2024. Growth percentage is calculated from the annual PV capacity additions shown above.
Major Chinese Manufacturers: Product Ranges, Scale, and Global Markets
Chinese MPPT inverter manufacturers serve residential, commercial, and utility-scale projects. Their product ranges commonly include single-phase units for homes, three-phase models for businesses, and high-capacity systems for solar plants. Some portfolios also include hybrid inverters that coordinate solar panels, batteries, and grid power. Choices vary by output, battery compatibility, monitoring features, and operating temperature. Small details matter.
Production scale ranges from specialized facilities to large factories with automated assembly and testing lines. Bigger output can support steady supply, but capacity alone says little about field reliability. Buyers should review test records, warranty terms, spare-parts access, and documented certifications for the destination market. Grid settings must match local requirements, and coastal or dusty sites may need suitable environmental protection.
Chinese suppliers sell into many overseas markets, where installation practices and service networks differ. Export experience can help with logistics and technical documentation, yet it does not guarantee prompt support in every region. Check whether manuals, monitoring software, and replacement components are available in the project’s working language and location. A practical comparison should weigh efficiency alongside service response and long-term maintenance. Published specifications are useful, but real-world performance still depends on system design and installation quality.